
Hi there,
I like drying my washing outside, I think it may be a Welsh thing, but my washing line is rarely empty.
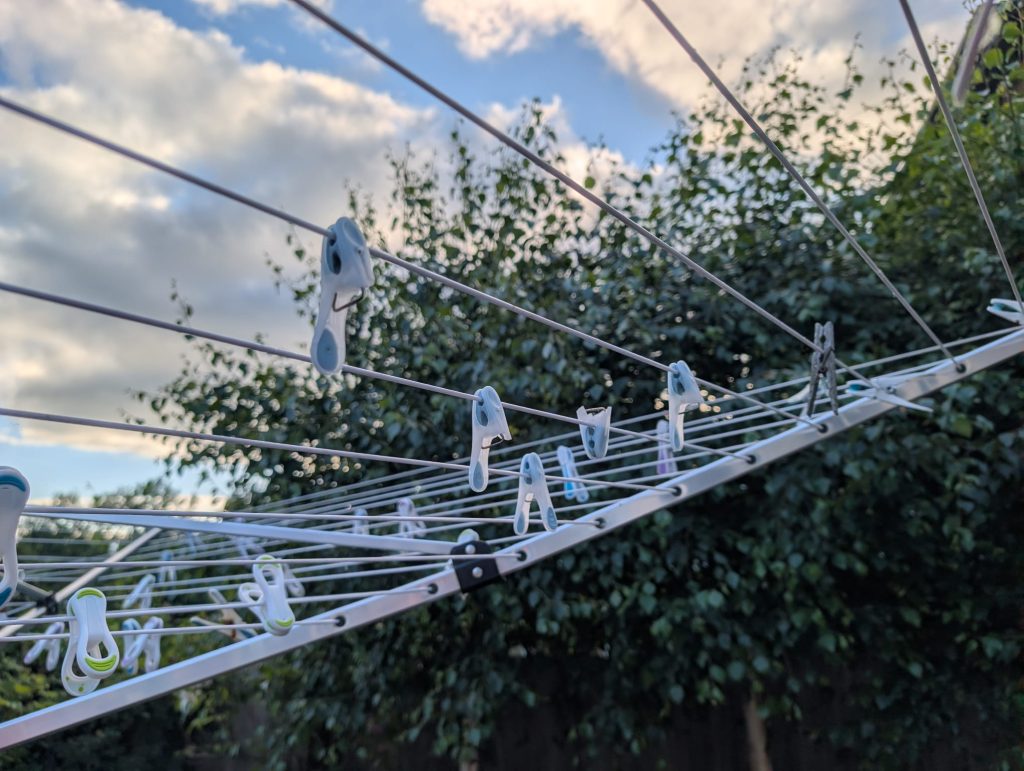
Those are my pegs, well, some of them – the broken ones.
And if you were doing a quick thematic analysis of my peg situation, you’d probably conclude: blue pegs are the problem. They’re obviously failing. The data is right there.
Except… are there just more blue pegs than any other colour? Were the blue ones bought two years ago and the others last month? What about the rest of the plastic in my garden, is that also degrading? If so, is blue specifically the issue, or is something else going on (cheap plastic? UV exposure? too lazy to put things away? not enough storage in the garden?)?
The blue peg conclusion isn’t wrong, exactly. It’s just incomplete and potentially misleading.
Thematic analysis: the basics
Thematic analysis is about finding patterns in data. You can go in with a framework already in mind (deductive analysis) where you’re testing whether your data fits known categories. Or you can approach a dataset with fresh eyes and see what emerges (inductive analysis) where the themes find you.
Both are legitimate. Both have their place.
What I see most often in healthcare, is single dataset thematic analysis: here is one set of data, here are the themes we found in it, here are our conclusions.
And that’s not nothing. But in healthcare, where our data is often incomplete, inconsistently recorded, and shaped by what gets reported rather than what actually happens, drawing firm conclusions from a single dataset is a bit like declaring blue pegs defective based on a cursory glance at the broken ones in a bucket.
The questions single-dataset analysis can’t answer
When we do a thematic review of medication errors, for example, we might identify recurring themes: handover gaps, labelling confusion, interruptions during administration. Useful.
But here’s what we don’t know from that analysis alone: are these patterns specific to medication administration, or do we see similar patterns across other complex tasks on the same ward? Are the same system conditions showing up in near misses that didn’t become incidents? What do staff say about their working conditions compared to what the incident records show?
Each additional data stream doesn’t just add information, it adds context. This context is what turns a list of themes into actual understanding of how your system is working.
The peg problem, restated
The broken blue pegs are real. I’m not saying ignore them. But the analysis that serves me best isn’t “blue pegs bad.” It’s what is happening in this garden, across all the plastic, across the weather, across the buying patterns, that helps me understand why things are breaking?
That’s a harder question. It takes longer. It requires more data sources and more willingness to hold uncertainty. It also gives you answers you can actually act on.
What data streams are you combining in your thematic reviews? I’d love to hear what’s working, and what the equivalent of “blue pegs” has turned out to be in your system.
Lauren